


match schedule
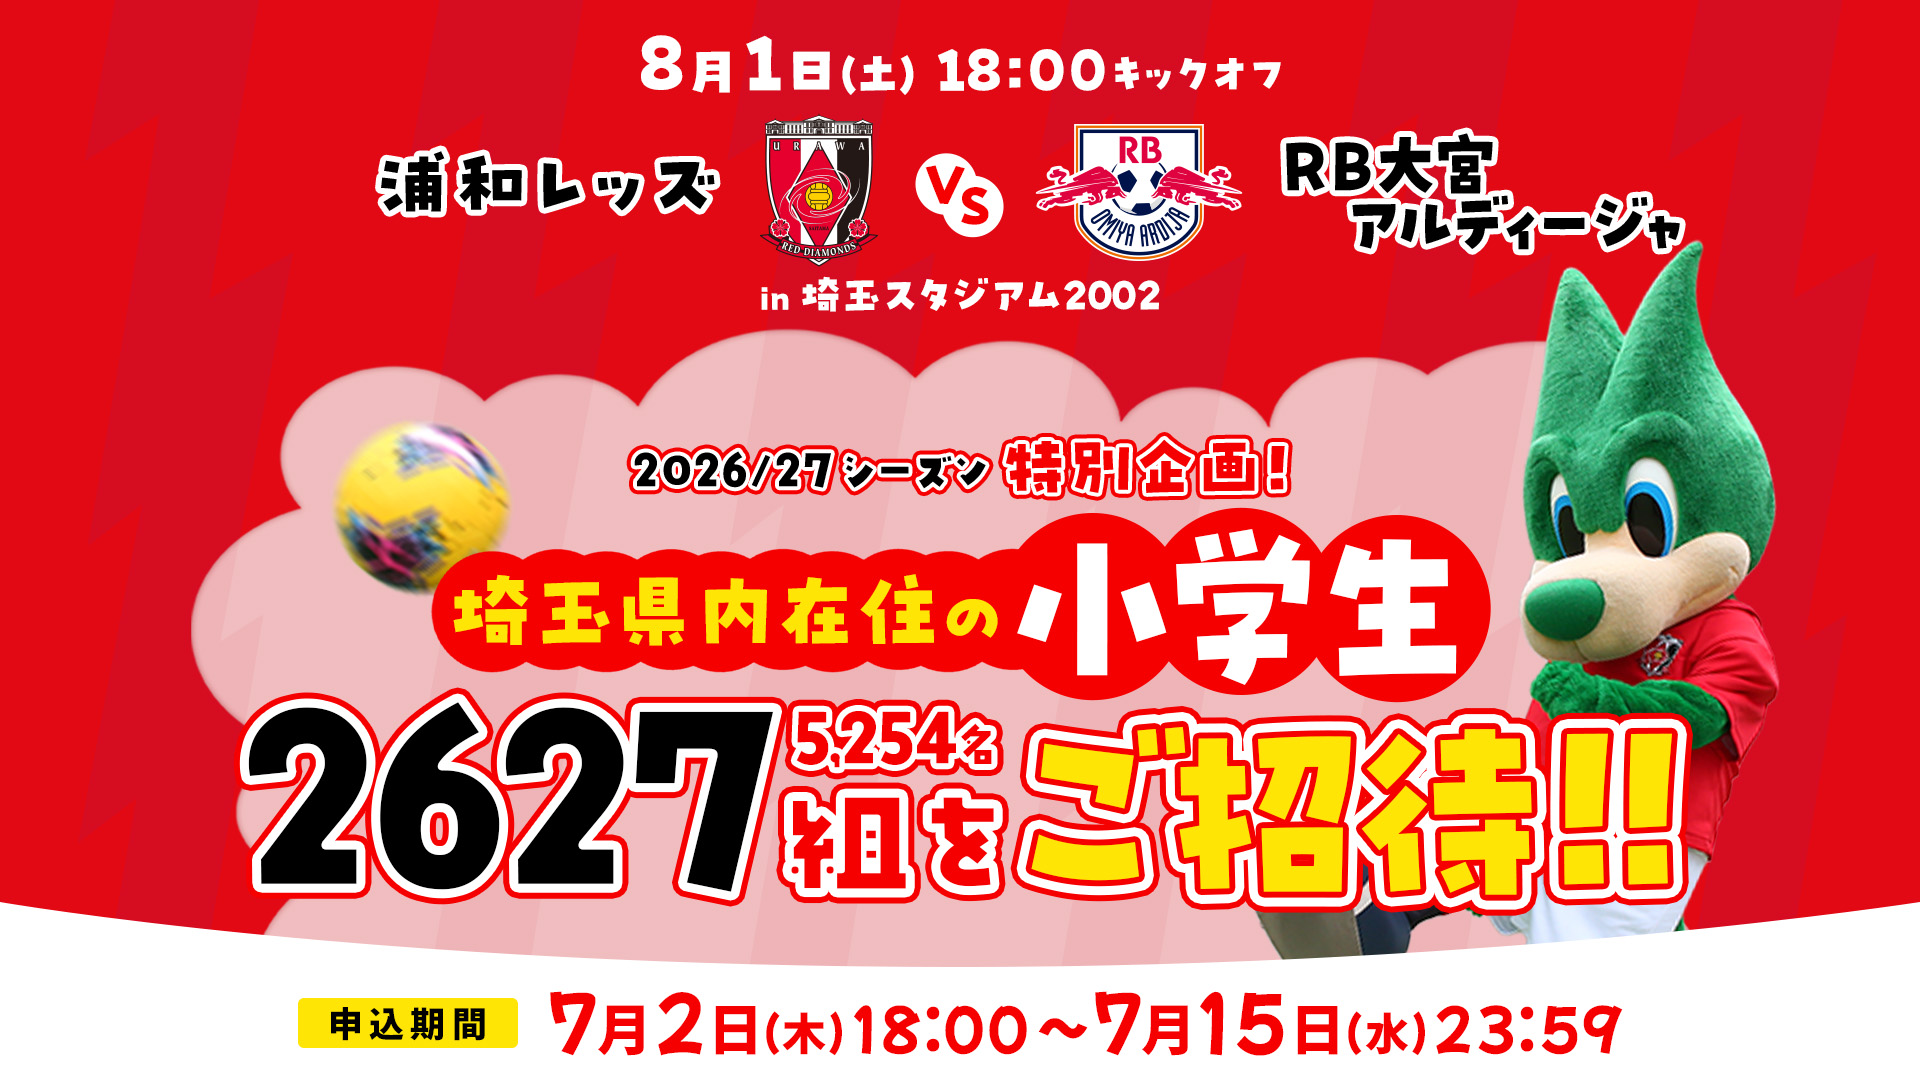
Juice Special Match
HomeSaitamaStadium 2002

RB Omiya Ardija
2026/27 Meiji Yasuda J1 League Matchday 1
PanasonicStadium Suita

Gamba Osaka
2026/27 Meiji Yasuda J1 League Matchday 2
HomeSaitamaStadium 2002
Sanfrecce Hiroshima

2026/27 Meiji Yasuda J1 League, Matchday 3
awayMUFG Stadium
FC Machida Zelvia
2026/27 Meiji Yasuda J1 League Matchday 4
HomeSaitamaStadium 2002
Yokohama F・Marinos

2026/27 Meiji Yasuda J1 League Matchday 5
awayBest Denki Stadium
Avispa Fukuoka
2026/27 Meiji Yasuda J1 League Matchday 6
awayMercari Stadium

Kashima Antlers
2026/27 Meiji Yasuda J1 League Matchday 7
HomeSaitamaStadium 2002

Fagiano Okayama
2026/27 Meiji Yasuda J1 League Matchday 8
HomeSaitamaStadium 2002

Tokyo Verdy
2026/27 Meiji Yasuda J1 League Matchday 9
away味の素スタジアム
FC東京
2026/27 Meiji Yasuda J1 League Matchday 10
awayMito Shinkin Bank Stadium
Mito Hollyhock
2026/27 Meiji Yasuda J1 League Matchday 11
HomeSaitamaStadium 2002

JEF United Ichihara Chiba
2026/27 Meiji Yasuda J1 League Matchday 12
HomeSaitamaStadium 2002
V-Varen Nagasaki
2026/27 Meiji Yasuda J1 League Matchday 13
oraway三協フロンテア柏スタジアム

Kashiwa Reysol
2026/27 Meiji Yasuda J1 League Matchday 14
awayMUFG Stadium

Vissel Kobe
2026/27 Meiji Yasuda J1 League Matchday 15
orawaySanga Stadium by KYOCERA
Kyoto Sanga F.C.
2026/27 Meiji Yasuda J1 League Matchday 16
HomeSaitamaStadium 2002
Cerezo Osaka
2026/27 Meiji Yasuda J1 League Matchday 17
awayIAIスタジアム日本平
Shimizu S-Pulse
2026/27 Meiji Yasuda J1 League Matchday 18
HomeSaitamaStadium 2002

Nagoya Grampus
2026/27 Meiji Yasuda J1 League Matchday 19
HomeSaitamaStadium 2002
Kawasaki Frontale
2026/27 Meiji Yasuda J1 League Matchday 20
awayPEACE STADIUM Connected by SoftBank
V-Varen Nagasaki
2026/27 Meiji Yasuda J1 League Matchday 21
awayMUFG Stadium
Tokyo Verdy
2026/27 Meiji Yasuda J1 League Matchday 22
orHomeSaitamaStadium 2002
Kashima Antlers
2026/27 Meiji Yasuda J1 League Matchday 23
orawayVenueTBA
Nagoya Grampus
2026/27 Meiji Yasuda J1 League Matchday 24
orawayUvanceとどろきスタジアム by Fujitsu
Kawasaki Frontale
2026/27 Meiji Yasuda J1 League Matchday 25
HomeSaitamaStadium 2002
FC東京
2026/27 Meiji Yasuda J1 League Matchday 26
awayMUFG Stadium
JEF United Ichihara Chiba
2026/27 Meiji Yasuda J1 League Matchday 27
orawayNissanStadium
Yokohama F・Marinos
2026/27 Meiji Yasuda J1 League Matchday 28
orHomeSaitamaStadium 2002
Shimizu S-Pulse
2026/27 Meiji Yasuda J1 League Matchday 29
orHomeSaitamaStadium 2002
Kashiwa Reysol
2026/27 Meiji Yasuda J1 League Matchday 30
orawayJFE晴れの国スタジアム
Fagiano Okayama
2026/27 Meiji Yasuda J1 League Matchday 31
orHomeSaitamaStadium 2002
Mito Hollyhock
2026/27 Meiji Yasuda J1 League Matchday 32
HomeSaitamaStadium 2002
FC Machida Zelvia
2026/27 Meiji Yasuda J1 League Matchday 33
orawayEdion Peace Wing Hiroshima
Sanfrecce Hiroshima
2026/27 Meiji Yasuda J1 League Matchday 34
HomeSaitamaStadium 2002
Vissel Kobe
2026/27 Meiji Yasuda J1 League Matchday 35
orHomeSaitamaStadium 2002
Avispa Fukuoka
2026/27 Meiji Yasuda J1 League Matchday 36
orHomeSaitamaStadium 2002
Kyoto Sanga F.C.
2026/27 Meiji Yasuda J1 League Matchday 37
orawayYANMAR HANASAKA STADIUM
Cerezo Osaka
2026/27 Meiji Yasuda J1 League Matchday 38
HomeSaitamaStadium 2002
Gamba Osaka
hot topics
-
[Important] Notice of discontinuation of paid membership service "Site Members"
![[Important] Notice of discontinuation of paid membership service "Site Members"](https://www.urawa-reds.co.jp/wp-content/uploads/2026/05/reds_logo_r-1-1.jpg)
-
曺 貴裁監督 沖縄トレーニングキャンプ囲み取材 「全ての状況でできるだけ主導権を握れるように、そして自分たちが自信を持って臨めるように、このキャンプで作っていく」

-
2026/27U-21 Jリーグ 日程発表

-
Applications are now open for "Flag Kids," a benefit for season ticket holders and REGULAR members for August home games!

-
Notice of change to training schedule on July 13th (Monday)

-
Training Match vs Okinawa International University Trial

-
Regarding the start of the U-21 team (updated 7/12)

-
Regarding the first match of the "Ryukyu Cup 2026" on July 17th (Fri):

ALL
Trial and Practice
top team
U-21 Trial and Practices
U-21 team
ALL
club
ticket
REX CLUB
Goods & Shop
Events & booths
partner
Heart-full Club
home town
SDGs
entertainment
nurturing
Women
Red's Land
-
team
曺 貴裁監督 沖縄トレーニングキャンプ囲み取材 「全ての状況でできるだけ主導権を握れるように、そして自分たちが自信を持って臨めるように、このキャンプで作っていく」
-
U-21 Trial and Practices
2026/27U-21 Jリーグ 日程発表
-
Trial and Practice
Notice of change to training schedule on Wednesday, July 15th
-
nurturing
To all players and guardians who participated in Urawa Reds Junior Team's first selection round:
-
ticket
Applications are now open for "Flag Kids," a benefit for season ticket holders and REGULAR members for August home games!
-
nurturing
To all players and guardians who participated in Urawa Reds Junior Team's first selection round:
-
nurturing
2026 GONTACUP U-11
-
nurturing
Trial Results Report (16th Urawa Training Center Exchange Meeting)
-
nurturing
Trial Results Report (Musashi Corporation Cup 2026 U-11 Tournament)
-
nurturing
Trial results report 2026 COPA BELLMARE U-11 PILOT INTERNATIONAL TOURNAMENT
-
Women
トレーニングマッチ vs 新潟医療福祉大学ほか合同チーム
-
Women
Regarding the training match to be held on Wednesday, July 15th
-
Women
Player's Column: "Taking Responsibility for the Emblem" -Ririka Tanno 's Vow for the New Season
-
Women
Restrictions on loud cheering and the use of noisemakers within the Redsland facility
-
Women
Niigata Camp - Toma Multipurpose Ground: Information on viewing locations (Updated 7/14)
Movie
top team players


![Partner Sales Representative [Official] X](/wp-content/themes/reds2019/img/banner/partner_x_bnr.jpg.jpg)